The method,in four moves.
Map, simulate, measure and control, improve. In this order, because technology only comes in after the flow is understood. Before the four, the concept that sets the pace for all of them: takt.
Takt is the conductor’s baton.
Taktzeit, in German, is the beat the baton sets for the orchestra. The word came from the German aircraft industry of the 1930s and became a foundation of the Toyota Production System.
Takt is the pace the customer sets for the process. Faster than takt, inventory piles up. Slower, a queue forms. Every operation has a takt. Most have never measured it.
Every 15 minutes, one proposal has to be done. That is the pulse.
No one improves what they can’t see.
In services, the queue lives in systems, e-mails and spreadsheets. In the factory, between one machine and the next. We map the value stream at the gemba and with the operation’s data, in a web tool: every step, every queue, every loss.
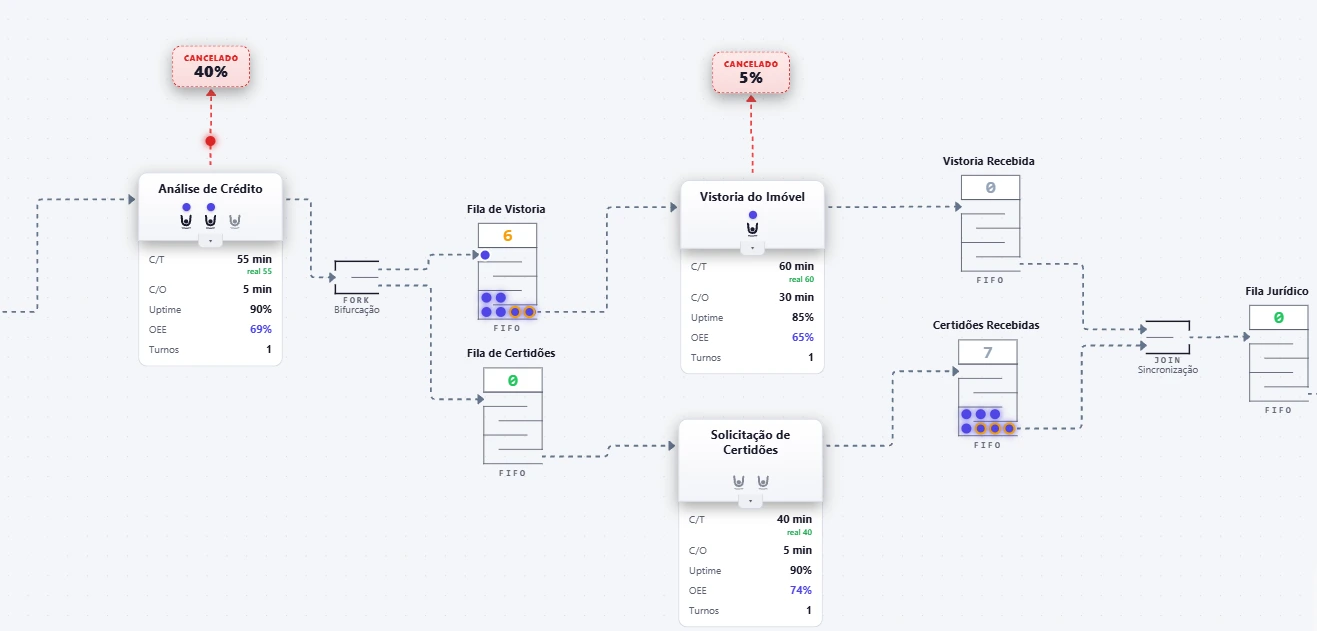
Screenshot of the tool in a real home equity lending operation (interface in Portuguese).
Measured cycle time shows next to the standard. The gap is in plain sight.
Parallel steps, like inspection and documents, synced before legal. The flow as it really is.
The loss shows up at the step where it happens, not in the month-end report.
Fail in the simulator. Succeed in the operation.
With the real times of each step, we build a digital twin of the process. Before hiring, reallocating or automating, we test the scenario and see the effect on queues and lead time.
Illustrative example: the same proposal flow as the map on the home page.
The operation beats with controlled variation.
Averages hide things. Every step has a distribution of times, and it is variation that blows the deadline. We measure every event against the limit the customer accepts and alert the moment a deviation happens, not at month-end close.
At Six Sigma, six standard deviations fit between the mean and the limit: 3.4 defects per million. Reduce the variation and watch the sigma level rise.
Analysis with a 48-min mean and a 60-min SLA. Defects per million include the 1.5σ shift, as in the Six Sigma standard.
Kaizen stops being an event. It becomes a heartbeat.
Kaizen is not one workshop a year. With the flow measured event by event, standard work is checked every day and every change shows up on the map itself: lead time drops, the queue shrinks, or the change goes back to the drawing board.
Perfection is the direction. Every cycle brings the process closer to it, and your team learns to run the cycle without depending on us.
Technology without flow automates waste.
Start with the map.
In two weeks, we map the flow of one critical process in your company and show where the gain is.
A direct conversation with Jonas Jeremias, the specialist.